During my studies at L'Ecole de design Nantes Atlantique, we made a partnership project with Audencia SciencesCom and the Department Loire-Atlantique. They give us their internal data about the territory. We had to illustrate those data with visual metaphor using photographies: a datalogy. The word datalogy was used for the first time in the book Dataflow 2 (Tames & Hudson). It means “analogy applied to data”.
This analogy represent the investment by the Department in schools. The glue stick represent the amount of money invest in the different field : books, road safety, biodiversity, nutrition… The coin above the glue stick represent the investment per pupil.
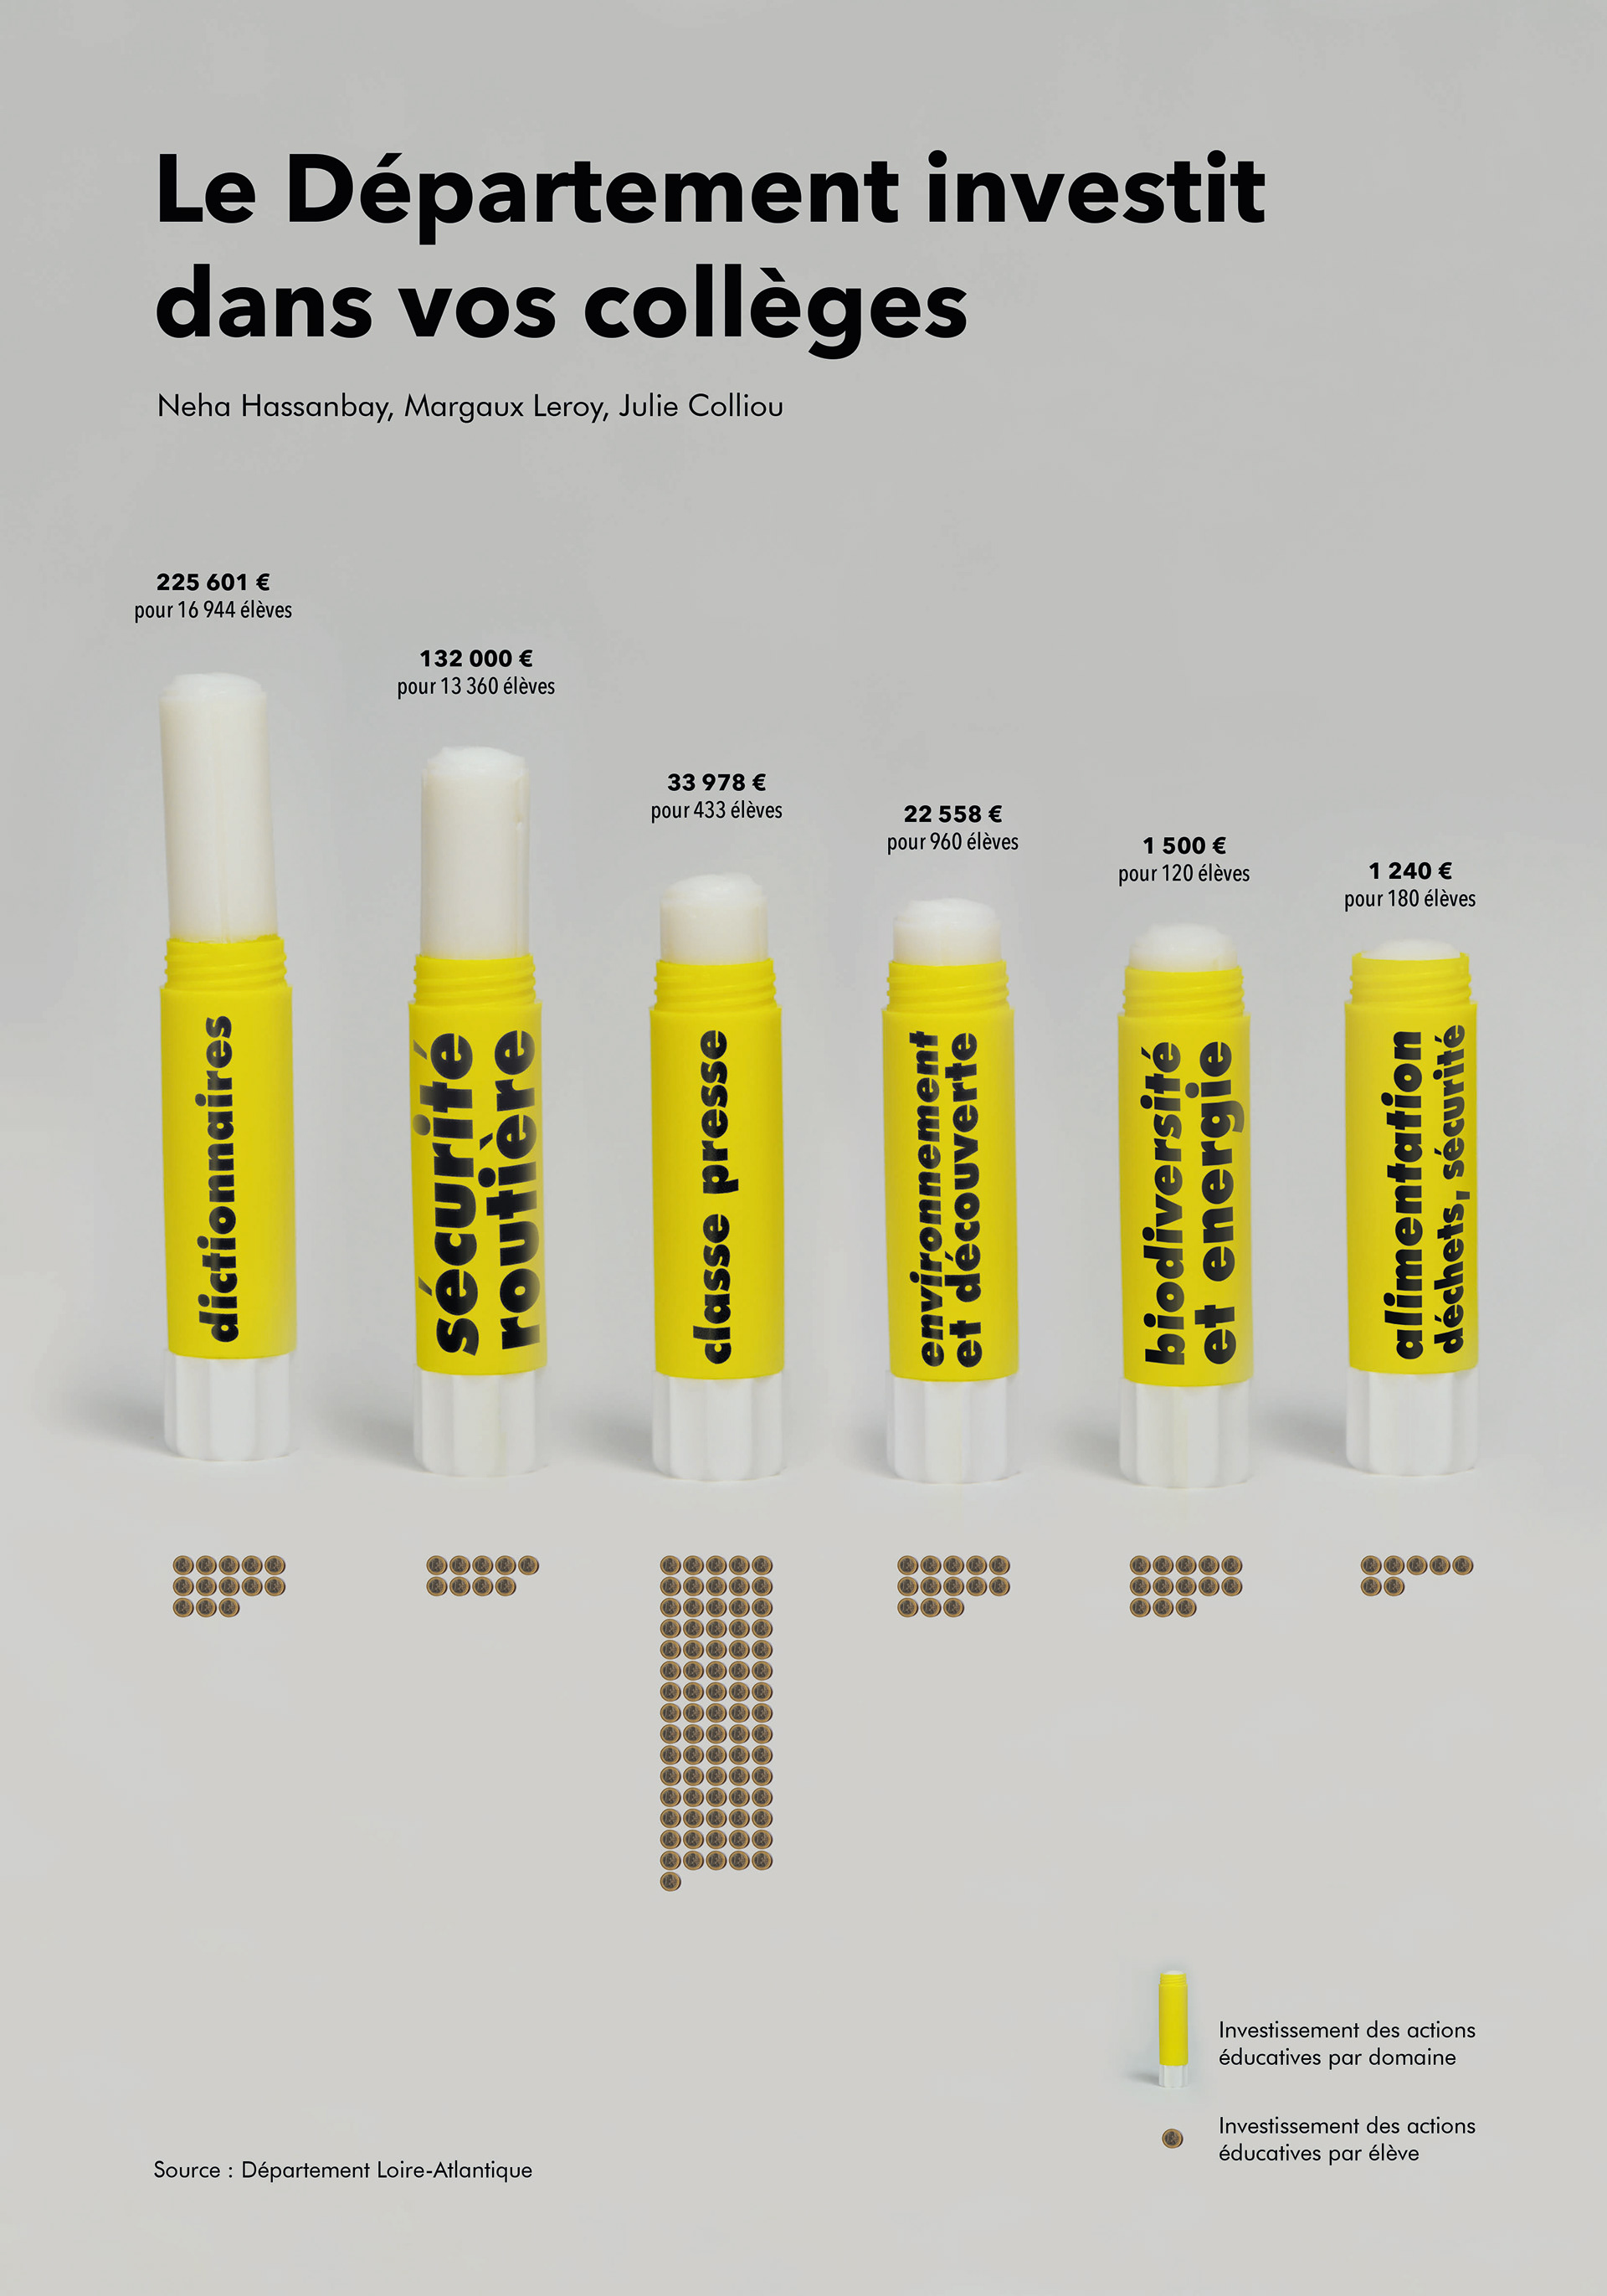
The data visualisations were released into the Datalogy 2 magazine and also presented in 2017 during the second edition of Datarama, an event of the Nantes Digital Week Festival.